SWC
INVESTMENTS
Focused, discreet capital management.
We manage capital for a select group of investors with a focus on capital preservation, disciplined risk management and long-term compounding.

We manage capital for a select group of investors with a focus on capital preservation, disciplined risk management and long-term compounding.
SWC is an investment company managing the SWC Hedged Equity Strategy. The objective of the SWC Hedged Equity Strategy is to achieve long term capital appreciation by primarily investing in a portfolio of broad based exchange traded funds. In addition, the Strategy systematically uses options to enhance yield and manage downside risk.
Chief Strategy Officer / Co-Founder
Before co-founding SWC in 2014, Mr. Bos worked for more than 20 years at financial institutions in New York, London and Amsterdam. Most recently, he worked as a senior advisor for…
MORE DETAILCo-Founder
Mr. Hammer worked for more than 20 years structuring and managing derivative investments and teams for global banks in London, Paris, Tokyo and New York. Most recently, he was…
MORE DETAILWe employ a disciplined, long-term approach to capital management with a primary focus on preserving and growing wealth across market cycles. Our monthly reports and key documents provide more detailed insight into our performance and investment approach.
We believe that protecting capital and compounding returns over time creates lasting wealth. Our approach prioritizes risk management and patience over short-term gains.
In November 2025 we generated a net return of -0.03% for the SWC Hedged Equity Fund Class I (USD), bringing our year-to-date performance to 15.05%.
Over longer periods our results continue to reflect our disciplined, risk-aware approach. We achieved annualized returns of 14.20% over three years (12.09% in EUR), 9.87% over five years (8.11% in EUR) and 9.40% over seven years (7.56% in EUR). During the same seven-year period our realized volatility was 8.13% and our maximum drawdown –10.72%, resulting in a Sharpe ratio of 0.81. We remain focused on balancing return generation with controlled downside risk.
| Metric | USD | EUR |
|---|---|---|
| Last 12 months | 13.32% | 11.05% |
| Annualized 3 years | 14.20% | 12.09% |
| Annualized 5 years | 9.87% | 8.11% |
| Annualized 7 years | 9.40% | 7.56% |
| Volatility 7 years | 8.13% | 8.14% |
| Max Drawdown | -10.72% | -12.33% |
| Average Interest last 7 years | 2.82% | 1.07% |
| Sharpe Ratio | 0.81 | 0.80 |
| Year | Jan | Feb | Mar | Apr | May | Jun | Jul | Aug | Sep | Oct | Nov | Dec | YTD | ITD |
|---|---|---|---|---|---|---|---|---|---|---|---|---|---|---|
| 2015 | 0.69% | 0.99% | 0.06% | 0.57% | 0.60% | -0.75% | 1.83% | -1.54% | 0.50% | 0.36% | 0.69% | 0.05% | 4.07% | 5.63% |
| 2016 | -2.56% | 0.71% | 1.28% | 0.84% | 0.74% | 1.87% | 0.84% | 0.58% | 0.75% | -0.36% | 0.24% | 0.73% | 5.75% | 11.69% |
| 2017 | 0.86% | 1.29% | 0.03% | 0.91% | 1.30% | 0.71% | 0.28% | 1.37% | 0.50% | 0.51% | 2.10% | 1.34% | 11.78% | 24.85% |
| 2018 | 1.22% | -5.94% | -2.60% | 0.85% | 1.36% | -0.46% | 0.23% | 1.75% | 0.86% | -4.05% | 0.25% | -2.09% | -8.60% | 14.12% |
| 2019 | 0.10% | 1.13% | 2.05% | 1.73% | -1.47% | 2.78% | 2.44% | -0.10% | 0.77% | -0.09% | 1.14% | 0.92% | 11.94% | 27.74% |
| 2020 | -0.01% | -3.83% | -4.74% | 4.74% | 1.73% | 1.65% | 2.32% | 1.28% | 0.13% | 0.44% | 3.38% | 0.10% | 7.01% | 36.70% |
| 2021 | -0.71% | 1.23% | 2.18% | 1.96% | 0.52% | 0.84% | 1.25% | 1.67% | -2.22% | 2.69% | -0.50% | 1.70% | 11.02% | 51.77% |
| 2022 | -3.39% | -1.58% | -0.13% | -4.91% | 0.47% | -0.24% | 4.80% | -1.37% | -4.57% | 4.54% | 3.60% | -2.68% | -5.88% | 42.84% |
| 2023 | 4.10% | -1.06% | 3.30% | 1.22% | 0.30% | 2.85% | 1.88% | -0.52% | -4.54% | -1.85% | 6.98% | 2.27% | 15.44% | 64.88% |
| 2024 | 1.34% | 3.09% | 3.09% | -2.54% | 1.98% | 2.78% | 0.67% | 0.95% | 1.03% | -0.60% | 4.17% | -1.50% | 15.23% | 89.99% |
| 2025 | 1.56% | -0.69% | -2.65% | -0.07% | 3.70% | 3.67% | 2.48% | 1.96% | 2.61% | 1.76% | -0.03% | - | 15.05% | 118.58% |
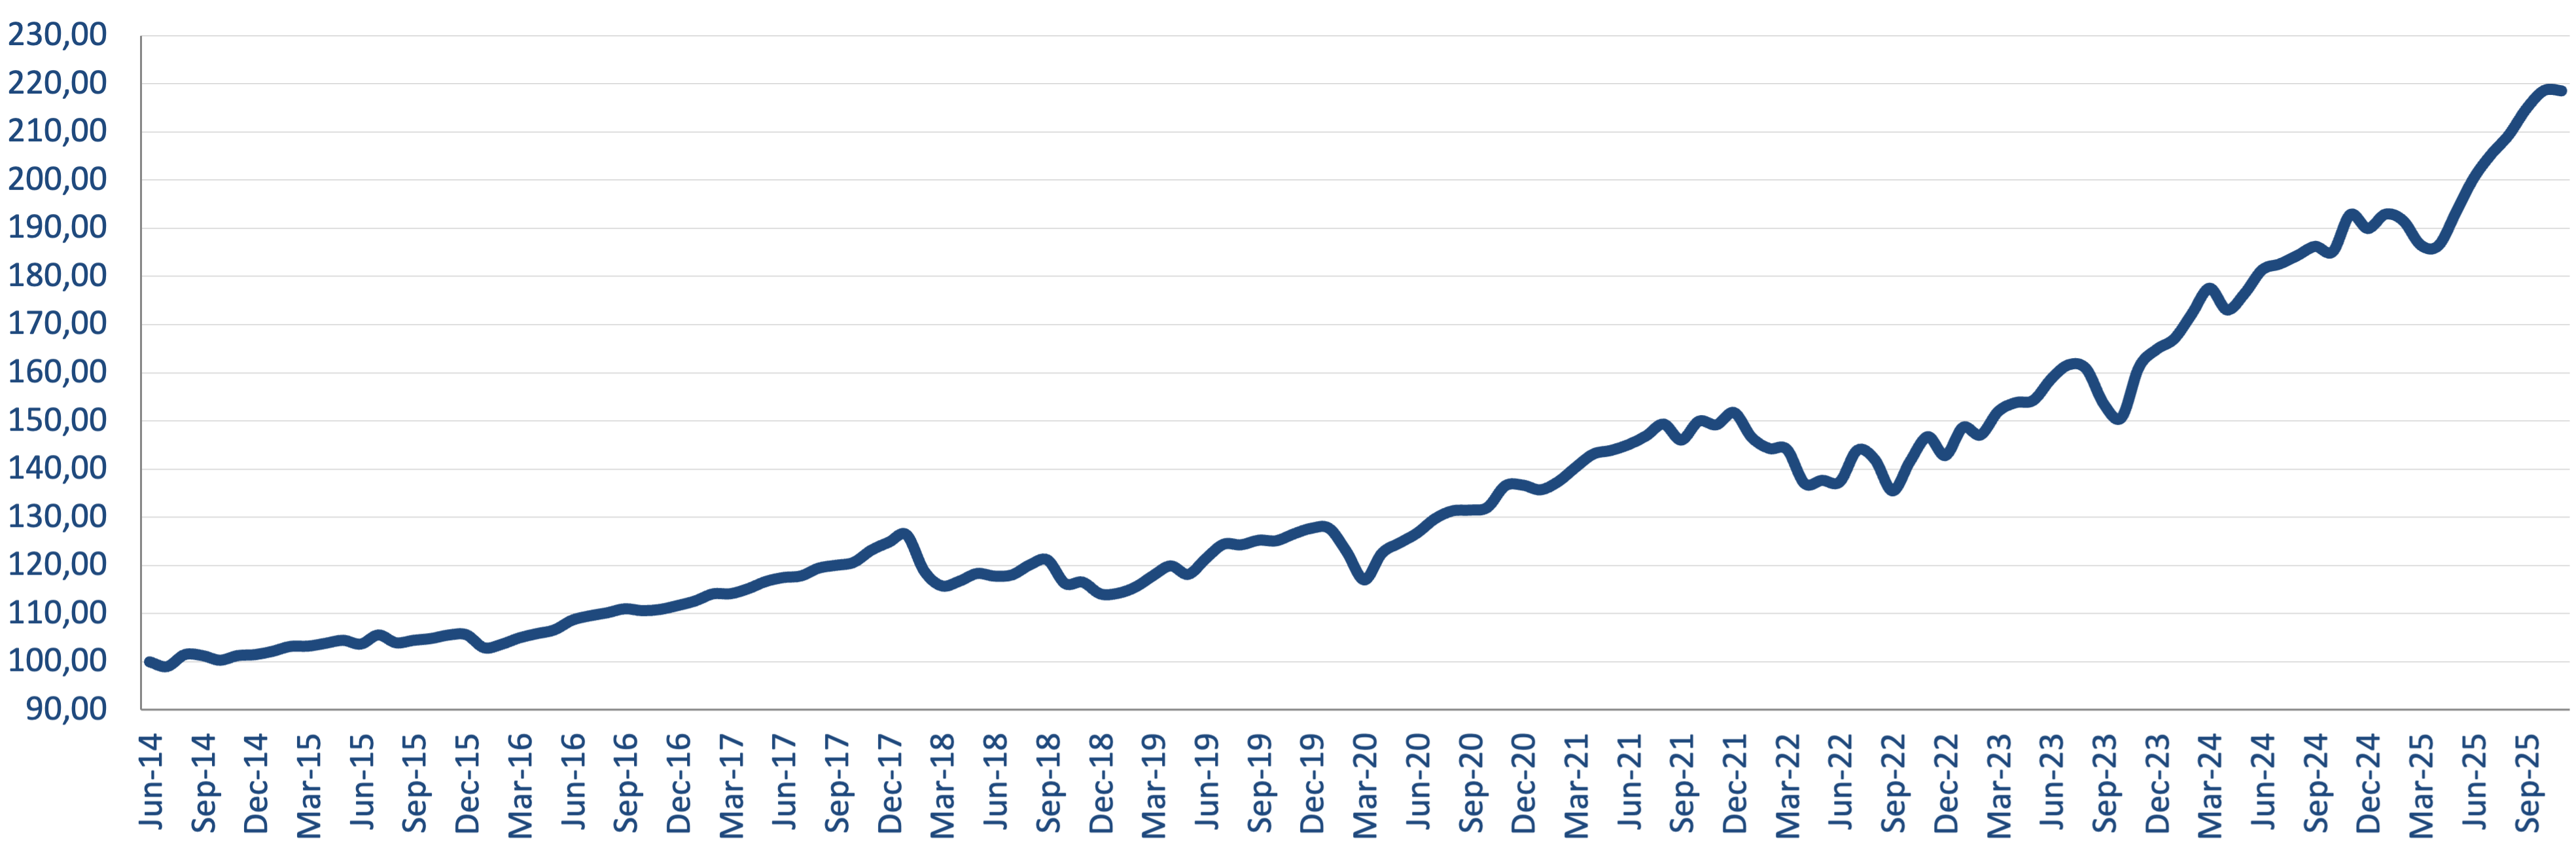
Since the launch of our USD share class in 2017, the fund's net asset value has followed a broadly upward path. We have seen periods of consolidation and temporary drawdowns, notably in late 2018, during the market disruption in early 2020 and in several months of 2022, but these were followed by subsequent recoveries as markets stabilised.
From 2023 onwards the cumulative performance has moved to new highs, supported by strong contributions in 2023, 2024 and 2025. The cumulative performance chart illustrates how our focus on risk management and consistent implementation has supported long-term capital growth with controlled volatility.
Attention! This investment falls outside AFM Supervision. No license and no prospectus required for this activity.
1) USD CLASS RETURNS ARE FGR USD CLASS LIVE NET RETURNS FROM FEBRUARY 2017, US FUND USD CLASS A LIVE NET RETURNS PRIOR TO FEBRUARY 2017.
2) EUR CLASS RETURNS ARE FGR EUR CLASS LIVE NET RETURNS FROM SEPTEMBER 2017, EURO HEDGED USD CLASS RETURNS IN EUR PRIOR TO SEPTEMBER 2017.
THIS COMMUNICATION IS PROVIDED BY SWC B.V. FOR INFORMATIONAL PURPOSES ONLY. NO PORTION OF THIS REPORT IS TO BE CONSTRUED AS A SOLICITATION TO BUY OR SELL A SECURITY OR THE PROVISION OF PERSONALIZED INVESTMENT, TAX OR LEGAL ADVICE. ANY OFFER OR SOLICITATION WILL ONLY BE MADE TO QUALIFIED PURCHASERS BY MEANS OF A CONFIDENTIAL PRIVATE PLACEMENT MEMORANDUM. CERTAIN INFORMATION CONTAINED IN THIS REPORT IS DERIVED FROM SOURCES BELIEVED BY SWC B.V. TO BE RELIABLE. PAST PERFORMANCE IS NO INDICATION OR GUARANTEE OF FUTURE RESULTS. DIFFERENT TYPES OF INVESTMENTS INVOLVE VARYING DEGREES OF RISK AND THERE CAN BE NO ASSURANCE THAT ANY MANAGEMENT STRATEGY WILL PROVE PROFITABLE. THE FEES AND EXPENSES CHARGED IN CONNECTION WITH THIS INVESTMENT MAY BE HIGHER THAN THE FEES AND EXPENSES OF OTHER INVESTMENT ALTERNATIVES AND MAY OFFSET PROFITS. INVESTMENT RESULTS MAY VARY SUBSTANTIALLY OVER ANY GIVEN TIME PERIOD. OPPORTUNITIES FOR WITHDRAWAL, REDEMPTION AND TRANSFERABILITY OF INTERESTS ARE RESTRICTED, SO INVESTORS MAY NOT HAVE ACCESS TO CAPITAL WHEN IT IS NEEDED. THERE IS NO SECONDARY MARKET FOR THE INTERESTS AND NONE IS EXPECTED TO DEVELOP. TRADING AND HOLDING OPTIONS MAY INVOLVE CERTAIN ADVANTAGES AND RISKS. THERE ARE NO GUARANTEES THAT SWC B.V. WILL BE ABLE TO ACHIEVE RETURNS SIMILAR TO THOSE STATED HEREIN. INVESTING INVOLVES THE RISK OF LOSS AND INVESTORS SHOULD BE PREPARED TO ABSORB SUCH A LOSS.
Access key documents and detailed performance information.
Should you have any questions regarding our services, please do not hesitate to contact us. We'll get back to you shortly.