SWC
INVESTMENTS
Focused, discreet capital management.
We manage capital for a select group of sophisticated investors with a focus on disciplined risk management and long-term compounding.

We manage capital for a select group of sophisticated investors with a focus on disciplined risk management and long-term compounding.
SWC is an investment company managing the SWC Hedged Equity Fund. The objective of the fund is to achieve long term capital appreciation by primarily investing in a portfolio of broad based exchange traded funds. In addition, we systematically use listed options to enhance yield and manage downside risk.
Chief Investment Officer / Co-Founder
Before co-founding SWC in 2014, Mr. Bos worked for more than 20 years at financial institutions in New York, London and Amsterdam. Most recently, he worked as a senior advisor for…
MORE DETAILCo-Founder
Mr. Hammer worked for more than 20 years structuring and managing derivative investments and teams for global banks in London, Paris, Tokyo and New York. Most recently, he was…
MORE DETAILWe employ a disciplined, long-term approach to capital management with a primary focus on growing wealth across market cycles. Our monthly reports and key documents provide more detailed insight into our performance and investment approach.
Our approach prioritizes risk management and patience over short-term gains.
In June 2026 we generated a net return of -0.80% for the SWC Hedged Equity Fund Class I (USD), bringing our year-to-date performance to 4.43%.
We achieved annualized returns of 12.80% over three years (10.80% in EUR), 9.44% over five years (7.57% in EUR) and 9.40% over seven years (7.67% in EUR). During the same seven-year period our realized volatility was 8.36% and our maximum drawdown –10.72%, resulting in a Sharpe ratio of 0.78. We remain focused on balancing return generation with controlled downside risk.
| Metric | USD1 | EUR2 |
|---|---|---|
| Last 12 months | 13.65% | 11.53% |
| Annualized 3 years | 12.80% | 10.80% |
| Annualized 5 years | 9.44% | 7.57% |
| Annualized 7 years | 9.40% | 7.67% |
| Volatility 7 years | 8.36% | 8.37% |
| Max Drawdown | -10.72% | -12.33% |
| Average Interest last 7 years | 2.91% | 1.26% |
| Sharpe Ratio | 0.78 | 0.77 |
1) USD CLASS RETURNS ARE FGR USD CLASS LIVE NET RETURNS FROM FEBRUARY 2017, US FUND USD CLASS A LIVE NET RETURNS PRIOR TO FEBRUARY 2017.
2) EUR CLASS RETURNS ARE FGR EUR CLASS LIVE NET RETURNS FROM SEPTEMBER 2017, EURO HEDGED USD CLASS RETURNS IN EUR PRIOR TO SEPTEMBER 2017.
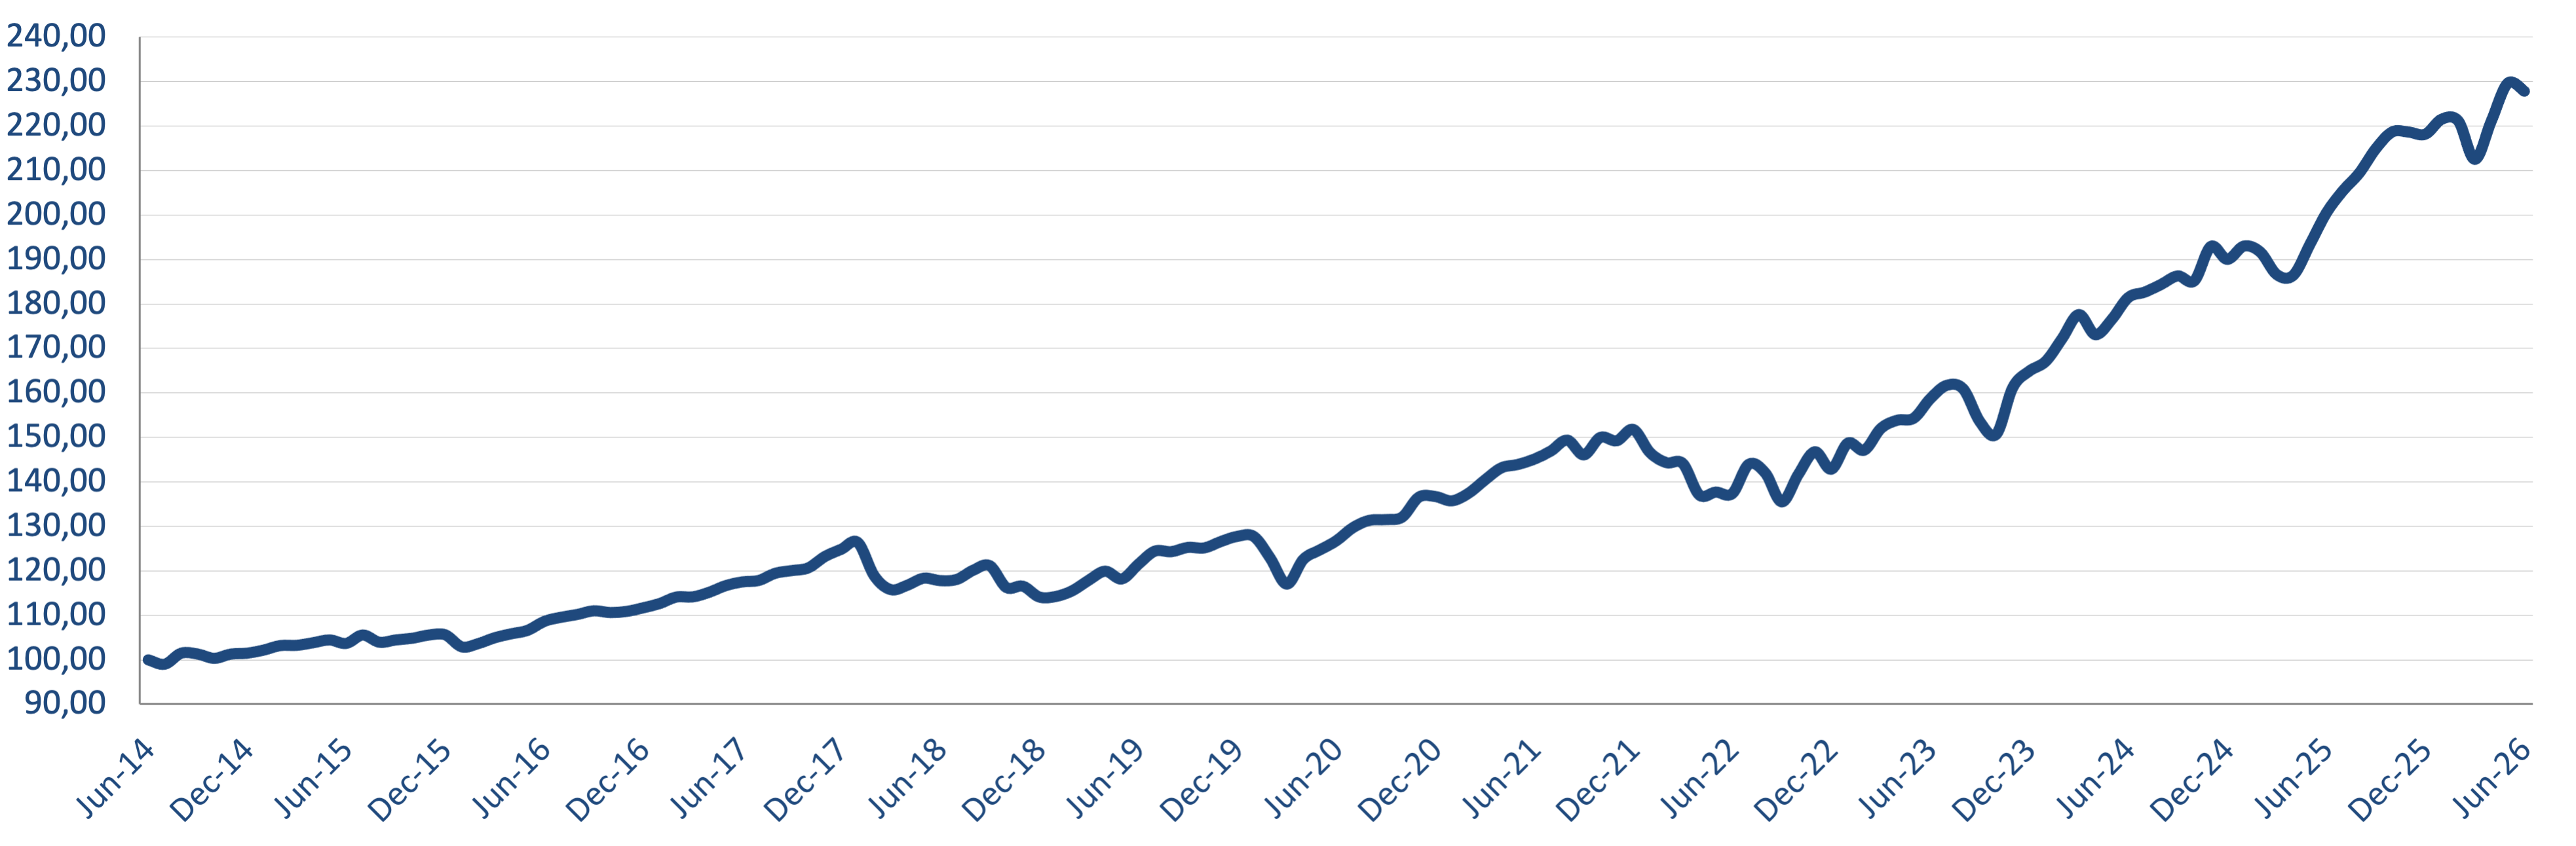
Since launch of the SWC Hedged Equity Fund FGR in 2017, the fund's net asset value has followed a broadly upward path. We have seen periods of consolidation and temporary drawdowns, notably in late 2018, during the market disruption in early 2020 and in several months of 2022, but these were followed by subsequent recoveries as markets stabilized.
From 2023 onwards the cumulative performance moved to new highs, supported by strong contributions in 2023, 2024 and 2025.
| Year | Jan | Feb | Mar | Apr | May | Jun | Jul | Aug | Sep | Oct | Nov | Dec | YTD | ITD |
|---|---|---|---|---|---|---|---|---|---|---|---|---|---|---|
| 2015 | 0.69% | 0.99% | 0.06% | 0.57% | 0.60% | -0.75% | 1.83% | -1.54% | 0.50% | 0.36% | 0.69% | 0.05% | 4.07% | 5.63% |
| 2016 | -2.56% | 0.71% | 1.28% | 0.84% | 0.74% | 1.87% | 0.84% | 0.58% | 0.75% | -0.36% | 0.24% | 0.73% | 5.75% | 11.69% |
| 2017 | 0.86% | 1.29% | 0.03% | 0.91% | 1.30% | 0.71% | 0.28% | 1.37% | 0.50% | 0.51% | 2.10% | 1.34% | 11.78% | 24.85% |
| 2018 | 1.22% | -5.94% | -2.60% | 0.85% | 1.36% | -0.46% | 0.23% | 1.75% | 0.86% | -4.05% | 0.25% | -2.09% | -8.60% | 14.12% |
| 2019 | 0.10% | 1.13% | 2.05% | 1.73% | -1.47% | 2.78% | 2.44% | -0.10% | 0.77% | -0.09% | 1.14% | 0.92% | 11.94% | 27.74% |
| 2020 | -0.01% | -3.83% | -4.74% | 4.74% | 1.73% | 1.65% | 2.32% | 1.28% | 0.13% | 0.44% | 3.38% | 0.10% | 7.01% | 36.70% |
| 2021 | -0.71% | 1.23% | 2.18% | 1.96% | 0.52% | 0.84% | 1.25% | 1.67% | -2.22% | 2.69% | -0.50% | 1.70% | 11.02% | 51.77% |
| 2022 | -3.39% | -1.58% | -0.13% | -4.91% | 0.47% | -0.24% | 4.80% | -1.37% | -4.57% | 4.54% | 3.60% | -2.68% | -5.88% | 42.84% |
| 2023 | 4.10% | -1.06% | 3.30% | 1.22% | 0.30% | 2.85% | 1.88% | -0.52% | -4.54% | -1.85% | 6.98% | 2.27% | 15.44% | 64.88% |
| 2024 | 1.34% | 3.09% | 3.09% | -2.54% | 1.98% | 2.78% | 0.67% | 0.95% | 1.03% | -0.60% | 4.17% | -1.50% | 15.23% | 89.99% |
| 2025 | 1.56% | -0.69% | -2.65% | -0.07% | 3.70% | 3.67% | 2.48% | 1.96% | 2.61% | 1.76% | -0.03% | -0.21% | 14.80% | 118.11% |
| 2026 | 1.56% | -0.19% | -3.90% | 4.07% | 3.84% | -0.80% | 4.43% | 127.77% |
Access key documents and detailed performance information.
Should you have any questions regarding our services, please do not hesitate to contact us. We'll get back to you shortly.
Email: janbos@swcinvestments.com